Read Time:1 Minute, 13 Second
Problem: Write a program that uses recursion to calculate dynamical systems such as the Lorenz attractor, Belousov-Zhabotinsky reaction, and visualize them using Turtle Graphics.
Solution
Step 1: Set up the Environment
First, we need to install the Turtle Graphics library, which comes with Python by default. We can start by creating a new Python script, let’s call it “dynamical_systems.py”.
Step 2: Define the Dynamical Systems Equations
Let’s pick the Lorenz attractor as an example. Define the Lorenz equations within a function. These equations represent the dynamics of a chaotic system:
def lorenz_equations(x, y, z):
    sigma = 10
    rho = 28
    beta = 8/3

    dx_dt = sigma * (y - x)
    dy_dt = x * (rho - z) - y
    dz_dt = x * y - beta * z

    return dx_dt, dy_dt, dz_dt
Step 3: Implement Recursive Visualization
Now, let’s create a function to visualize the Lorenz attractor using Turtle Graphics:
import turtle

def draw_lorenz(x, y, z, steps):
    turtle.penup()
    turtle.goto(x, z)
    turtle.pendown()
    for _ in range(steps):
        dx, dy, dz = lorenz_equations(x, y, z)
        x, y, z = x + dx * 0.01, y + dy * 0.01, z + dz * 0.01
        screen_x, screen_z = 10*x, 10*z
        turtle.goto(screen_x, screen_z)
    turtle.done()

if __name__ == "__main__":
    draw_lorenz(1, 0, 0, 1000)
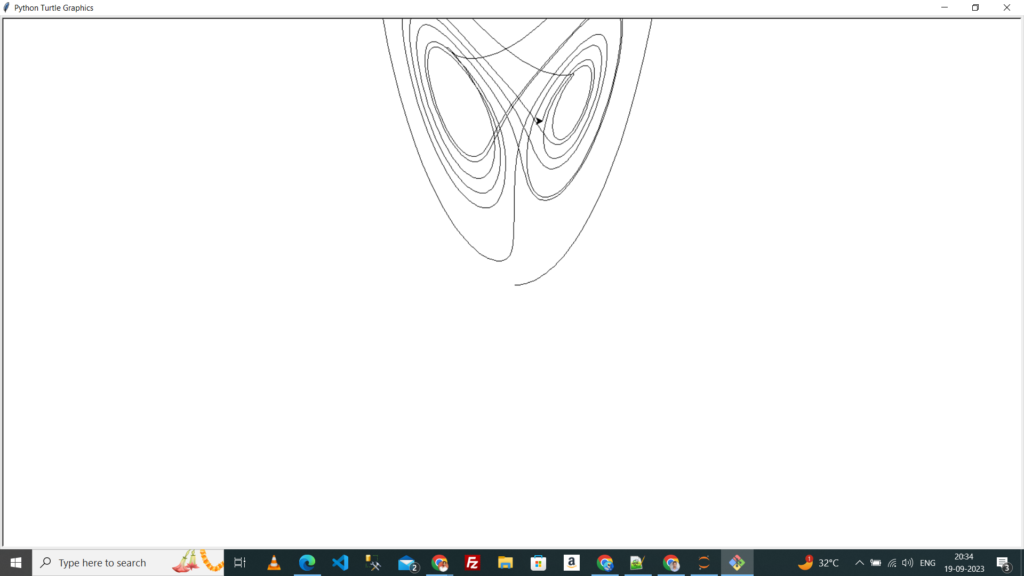
This script sets up the Turtle Graphics window and uses the recursive function to calculate the Lorenz attractor’s trajectory and visualize it on the screen.
Sample Output
Happy
0 %
Sad
0 %
Excited
0 %
Sleepy
0 %
Angry
0 %
Surprise
0 %